Merriam-Webster defines an insight as an understanding of the true nature of something. Many companies seem to define an insight as any piece of data or information, which I would call a pseudo-insight. This post surveys some examples of pseudo-insights, and discusses how these can be built upon to provide real insights.
Exhibit A: WordPress stats
This website is hosted on wordpress.com. I’m generally happy with WordPress – though it’s not as exciting and shiny as newer competitors, it is rock-solid and very feature-rich. An example of a great WordPress feature is the new stats area (available under wordpress.com/stats if you have a WordPress website). This area includes an insights page, which is full of prime examples of pseudo-insights.
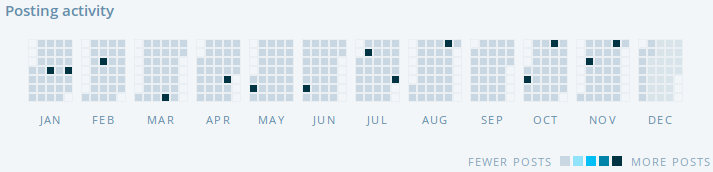
At the top of the insights page, there is a visualisation of posting activity. As the image below shows, this isn’t very interesting for websites like mine. I already know that I post irregularly, because writing a blog post is time-consuming. I suspect that this visualisation isn’t very useful even for more active multi-author blogs, as it is essentially just a different way of displaying the raw data of post dates. Without joining this data with other information, we won’t gain a better understanding of how the blog is performing and why it performs the way it does.
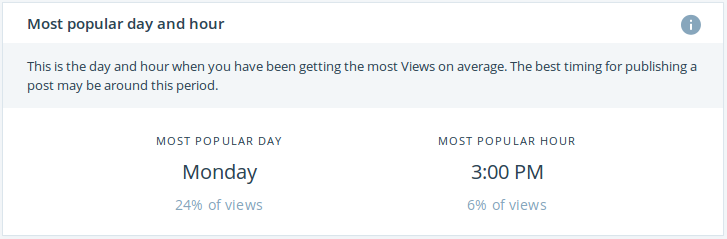
An attempt to extract more meaningful insights from posting times appears further down the page, in the form of a widget that tells you the most popular day and hour. The help text says that This is the day and hour when you have been getting the most Views on average. The best timing for publishing a post may be around this period. Unfortunately, I’m pretty certain that this isn’t true in my case. Monday happens to be the most popular day because that’s when I published two of my most popular posts, and I usually try to spread the word about a new post as soon as I publish it. Further, blog posts can become popular a long time after publication, so it is unlikely that the best timing for publishing a post is around Monday 3pm.
What would real WordPress insights look like? If we stick to idea of exploring the effect of publication timing, I would be curious to know if there is indeed a link between when a post is published and its popularity. Automattic (the company behind WordPress) is in a position to test this, as they can explore data from millions of blogs. My gut feeling is that the time of publication has a negligible effect on popularity. Things that matter much more are a post’s title, content, and effective distribution channels. Given the amount of data that they have, Automattic data scientists can definitely explore all of these factors. This would allow them to surface insights that will help authors drive more quality traffic to their websites.
Exhibit B: Facebook page insights
As anyone who manages a Facebook page probably knows, Facebook provides pretty rich analytics of pages on their platform. For example, you can see the likes you’ve received over time and how your posts perform, and slice and dice this information in various ways. This is a great feature, but again, calling it insights is a misuse of the word and somewhat of an insult for those of us who work to extract real insights from data. An analytics dashboard is not insights.
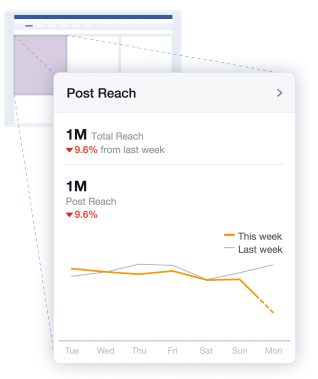
What would real Facebook page insights look like? Working off the assumption that people manage a Facebook page to reach and engage their audience, real insights would enhance a page administrator’s understanding of their audience and improve their ability to engage them and reach new people. However, Facebook is famous for having a conflict of interest here, because they require you to pay to reach more people. For example, if a post you shared is performing better than usual, Facebook will send you a notification, asking you to pay to boost the post further. It would be better if they told you what has caused this post to reach more people, and how to reproduce this success with future posts (for free). But this is very unlikely to happen. In the words of CGP Grey: professional sharers cannot trust the platforms upon which they stand, audiences cannot trust the platform to show what they asked to see.
Exhibit C: LinkedIn profile views
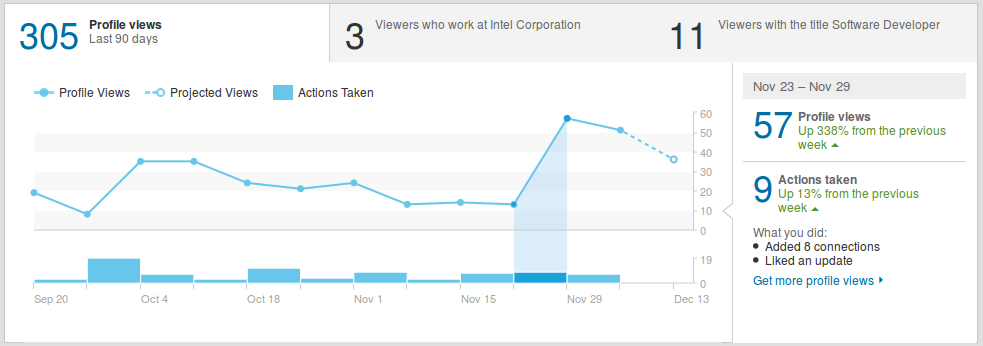
Who’s viewed your profile is a popular LinkedIn feature. A key part of this feature is a graph that includes your weekly profile views together with actions taken on LinkedIn. The official LinkedIn blog calls this graph the insights graph and provides some examples for its uses:
So, for example, if you are trying to attract new clients or business leads, you can see how many potential partners looked at your profile after you joined an important industry group. Or, if you’re looking for a new job, you can look at your insights graph to see whether adding a skill to your profile or endorsing a peer gave you a bigger bump in views by recruiters. No matter your goal, you’ll be able to see which actions lead to the most relevant profile views – then start reaching out and closing the sale or applying for your dream job.
As the examples show, the so-called insights graph merely provides information about past actions and profile views on the LinkedIn platform. It is up to you to come up with the insights, but this may be hard if you consider only the actions taken within the walled garden of LinkedIn. For example, as shown in the following graph, my profile views received a boost on the week starting November 23, which was mostly due to publishing a popular post on this website. In general, social networks such as LinkedIn, Twitter, and Facebook tend to have a very narrow view of the world – as if the only interesting things happen on the platform. In reality, most of the action happens off-platform, either within other digital assets or in the physical world.
What would real LinkedIn insights look like? First, I think that the focus on profile views is somewhat misguided. It’s not that hard to artificially generate profile views – simply view other people’s profiles. There is no intrinsic value in someone having viewed your profile – the value comes from a connection that leads to an interesting offer or conversation. Second, LinkedIn is about professional networking that is based on real-world activity. As such, it only forms a small part of the world of professional networking by allowing people to have an online presence that makes them contactable by people they don’t already know. When it comes to insights, it’d be useful to know the true causal factors that lead to interesting connections – much more useful than suggestions such as add software development as a skill on your profile to get up to 3% more profile views.
Summary: Real insights are about the why
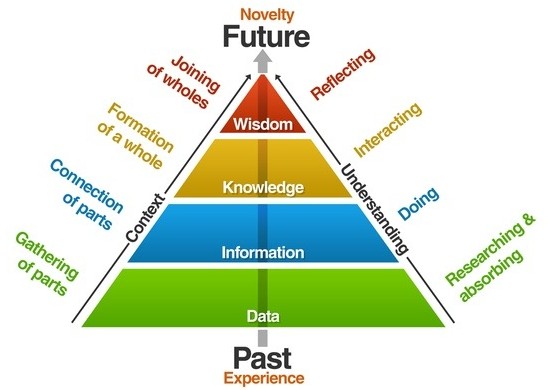
There are many other examples of pseudo-insights out there. The reason is probably that the field of analytics is becoming increasingly commoditised, and it is easier to rebrand an analytics dashboard as an insights dashboard than to provide real insights. Providing real insights requires moving up the DIKW pyramid from data and information to knowledge and wisdom – from describing the past to learning general lessons that allow you to influence the future. Providing real insights can be very hard, as it often requires inferring the causes of events – the why that comes after the what and how. More on this later – I have just started reading Samantha Kleinberg’s Why: A Guide to Finding and Using Causes and will report (hopefully real) insights on causality in future posts.
Public comments are closed, but I love hearing from readers. Feel free to contact me with your thoughts.
Greg Ichneumon Brown
2015-12-21 22:52:05
Nice post. Mostly agree. Automated insights are hard to automate though, but we (the WordPress.com Data Team) are working on it.
Some of the things we’ve found that have the biggest impact on successful blogging are:
There’s still a lot to learn here. Interested in helping? https://automattic.com/work-with-us/data-wrangler/ :)
Yanir Seroussi
2015-12-27 19:48:26
Thanks Greg! All those factors make sense. Personally, I prefer sharing posts manually to turning on Publicize, but I suppose it has the same effect. My guess is that one of the reasons why images are important is that having at least one image makes posts stick out when shared on social media.
By the way, I did apply for the data wrangler position a couple of months ago but never heard back. It’s probably too late now, as I have a different position (and a few other options) lined up when I get home from vacation next month :)
Greg Ichneumon Brown
2015-12-28 04:26:19
Hey Yanir, that’s embarrassing. :)
Sorry we haven’t gotten back to you yet. I do see you in our queue. Its been a busy two months so we’re a bit backed up, but getting back on track in the next week or two. Certainly understand if that doesn’t fit into your own timeline. Sorry if that ends up being the case.